AWS X-Ray Now Supports Amazon API Gateway and New Sampling Rules API
- September 7, 2018


|
My colleague Jeff first introduced us to AWS X-Ray almost 2 years ago in his post from AWS re:Invent. If you’re not already aware, AWS X-Ray helps developers analyze and debug everything from simple web apps to large and complex distributed microservices, both in production and in development. Since X-Ray became generally available in 2017, we’ve iterated rapidly on customer feedback and continued to make enhancements to the service like encryption with AWS Key Management Service (KMS), new SDKs and language support (Python!), open sourcing the daemon, and latency visualization tools. Today, we’re adding two new features:
Let me show you how to enable tracing for an API.
I’ll start with a simple API deployed to API Gateway. I’ll add two endpoints. One to push records into Amazon Kinesis Data Streams and one to invoke a simple AWS Lambda function. It looks something like this: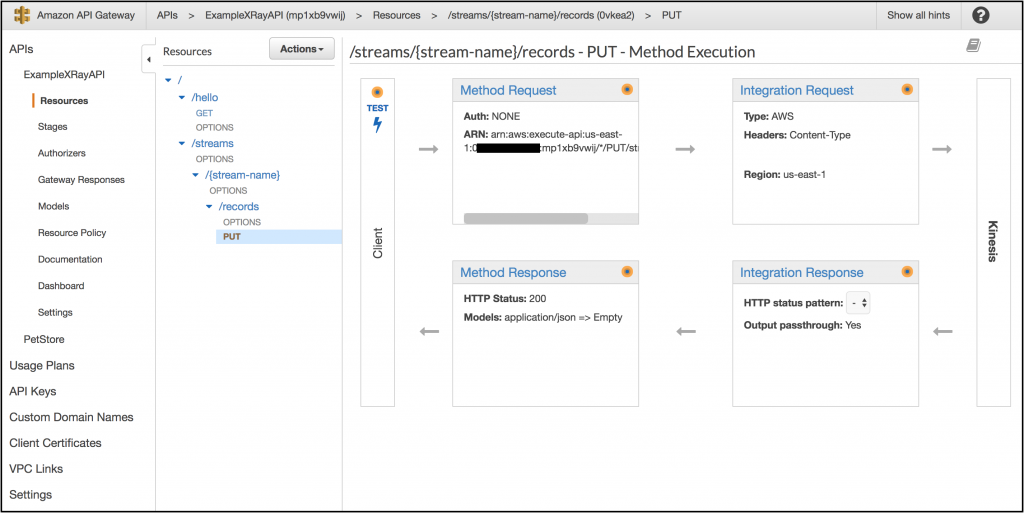
After deploying my API, I can go to the Stages sub console, and select a specific stage, like “dev” or “production”. From there, I can enable X-Ray tracing by navigating to the Logs/Tracing tab, selecting Enable X-Ray Tracing and clicking Save Changes.
After tracing is enabled, I can hop over to the X-Ray console to look at my sampling rules in the new Sampling interface.
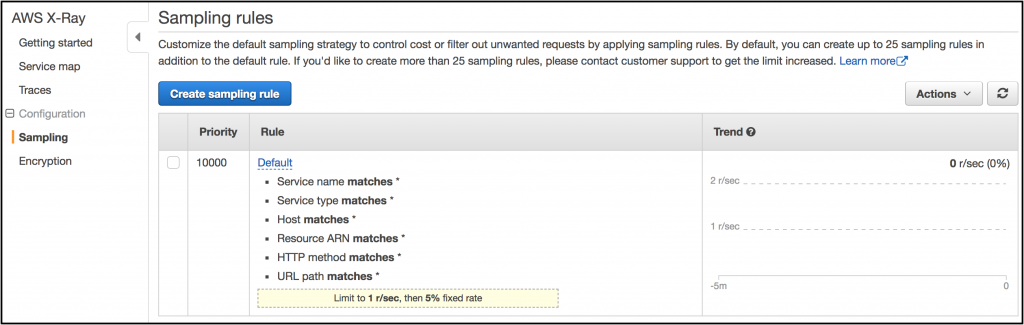
I can modify the rules in the console and, of course, with the CLI, SDKs, or API. Let’s take a brief interlude to talk about sampling rules.
Sampling Rules
The sampling rules allow me to customize, at a very granular level, the requests and traces I want to record. This allows me to control the amount of data that I record on-the-fly, across code running anywhere (AWS Lambda, Amazon ECS, Amazon Elastic Compute Cloud (EC2), or even on-prem) – all without having to rewrite any code or redeploy an application. The default rule that is pictured above states that it will record the first request each second, and five percent of any additional requests. We talk about that one request each second as the reservoir, which ensures that at least one trace is recorded each second. The five percent of additional requests is what we refer to as the fixed rate. Both the reservoir and the fixed rate are configurable. If I set the reservoir size to 50 and the fixed rate to 10%, then if 100 requests per second match the rule, the total number of requests sampled is 55 requests per second. Configuring my X-Ray recorders to read sampling rules from the X-Ray service allows the X-Ray service to maintain the sampling rate and reservoir across all of my distributed compute. If I want to enable this functionality, I just install the latest version of the X-Ray SDK and daemon on my instances. At the moment only the GA SDKs are supported with support for Ruby and Go on the way. With services like API Gateway and Lambda, I can configure everything right in the X-Ray console or API. There’s a lot more detail on this feature in the documentation, and I suggest taking the time to check it out.
While I can, of course, use the sampling rules to control costs, the dynamic nature and the granularity of the rules is also extremely powerful for debugging production systems. If I know one particular URL or service is going to need extra monitoring I can specify that as part of the sampling rule. I can filter on individual stages of APIs, service types, service names, hosts, ARNs, HTTP methods, segment attributes, and more. This lets me quickly examine distributed microservices at 30,000 feet, identify issues, adjust some rules, and then dive deep into production requests. I can use this to develop insights about problems occurring in the 99th percentile of my traffic and deliver a better overall customer experience. I remember building and deploying a lot of ad-hoc instrumentation over the years, at various companies, to try to support something like this, and I don’t think I was ever particularly successful. Now that I can just deploy X-Ray and adjust sampling rules centrally, it feels like I have a debugging crystal ball. I really wish I’d had this tool 5 years ago.
Ok, enough reminiscing, let’s hop back to the walkthrough.
I’ll stick with the default sampling rule for now. Since we’ve enabled tracing and I’ve got some requests running, after about 30 seconds I can refresh my service map and look at the results. I can click on any node to view the traces directly or drop into the Traces sub console to look at all of the traces.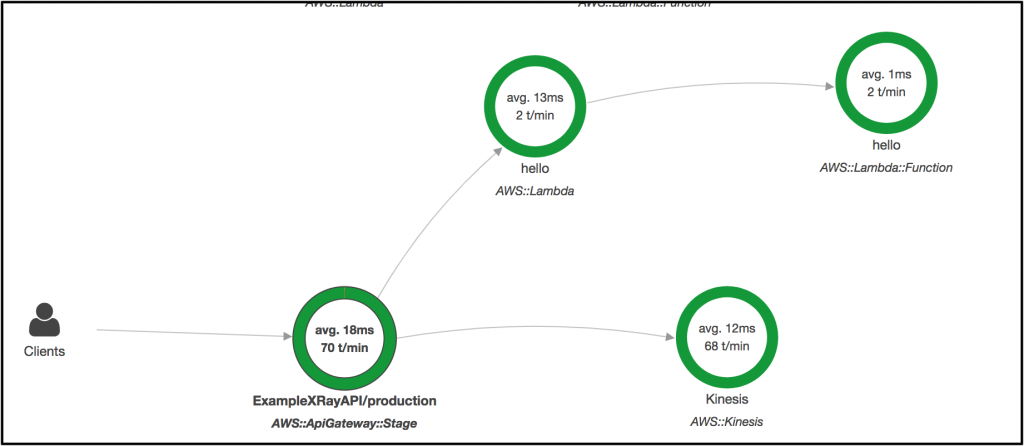
From there, I can see the individual URLs being triggered, the source IPs, and various other useful metrics.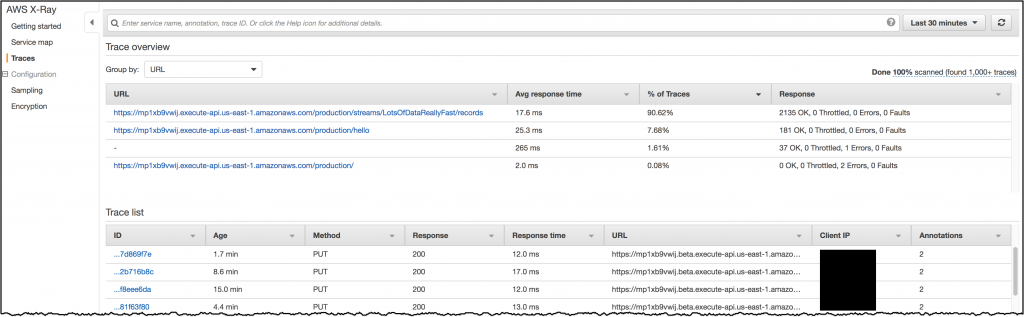
If I want to dive deeper, I can write some filtering rules in the search bar and find a particular trace. An API Gateway segment has a few useful annotations that I can use to filter and group like the API ID and stage. This is what a typical API Gateway trace might look like.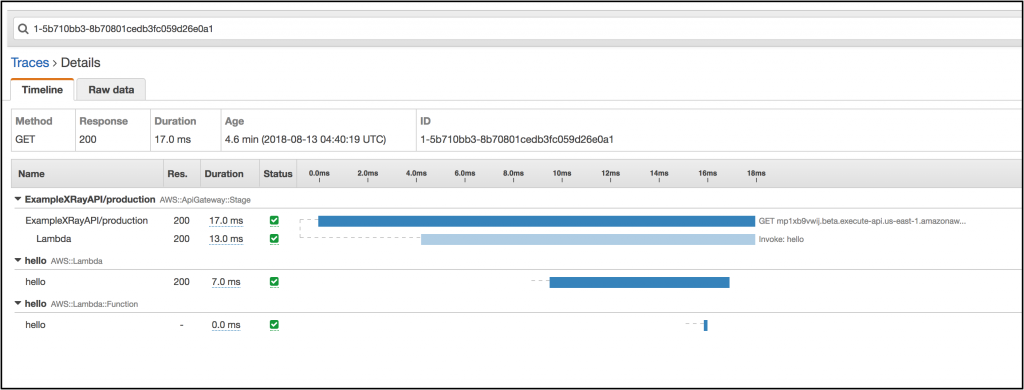
Adding API Gateway support to X-Ray gives us end-to-end production traceability in serverless environments and sampling rules give us the ability to adjust our tracing in real time without redeploying any code. I had the pleasure of speaking with Ashley Sole from Skyscanner, about how they use AWS X-Ray at the AWS Summit in London last year, and these were both features he asked me about earlier that day. I hope this release makes it easier for Ashley and other developers to debug and analyze their production applications.
Support for both of these features is available, today, in all public regions that have both API Gateway and X-Ray. In fact, X-Ray launched their new console and API last week so you may have already seen it! You can start using it right now. As always, let us know what you think on Twitter or in the comments below.
– Randall