Analyze Data Relationships at Speed and Scale
- October 29, 2022

In order to explore relationships between extremely large volumes of data with speed and efficiency, graph analytics have been emerging to fill the need when that is not easily achieved with traditional or relational databases.
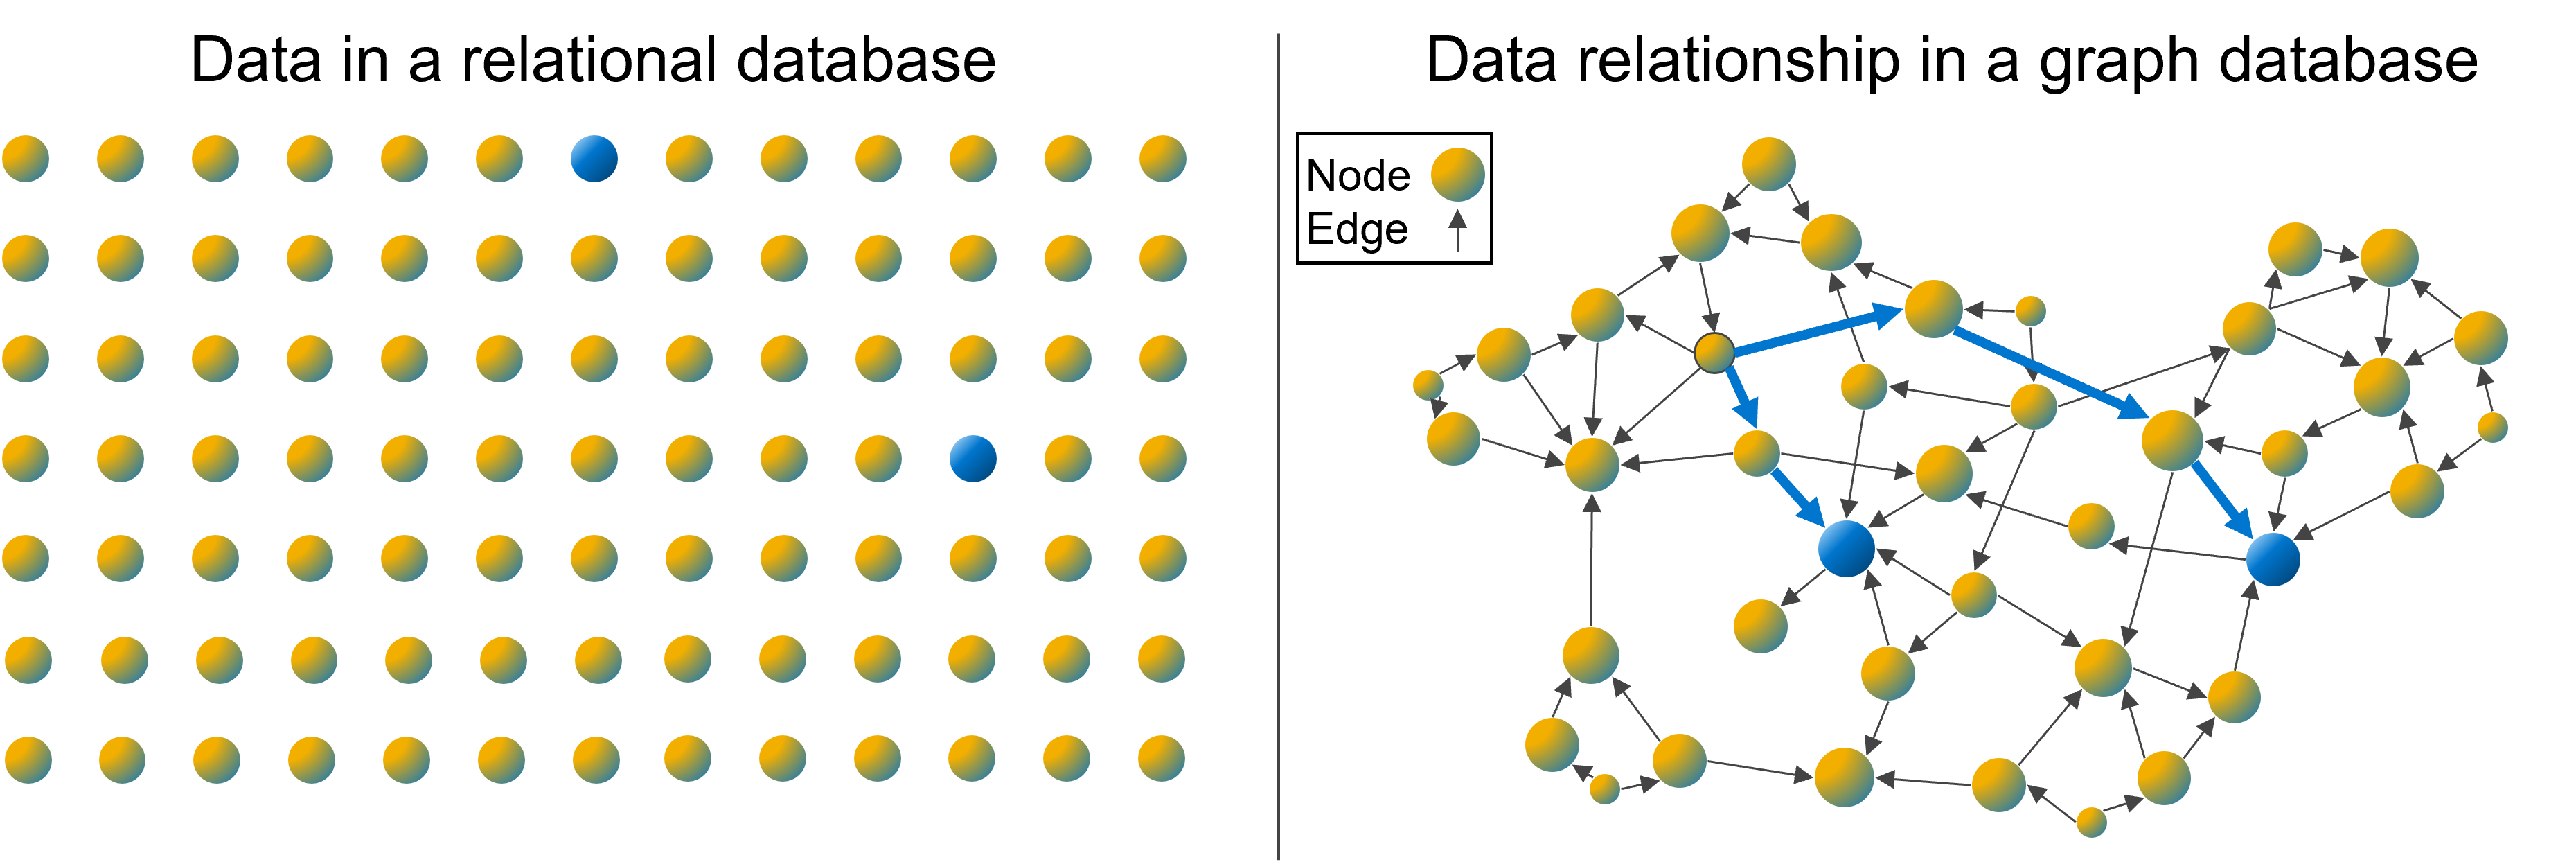
The logical structure of tables and columns used by relational databases makes it difficult to connect all the information and analyze how it is linked, especially when trying to analyze relationships in multiple layers. The more layers you try to analyze, the harder it gets from a relational database perspective, given that you need to access more tables. The chart on the left, shows how all the data is connected to what you are trying to analyze. On the right, graph-powered analytics was able to connect all the data using a node and edge approach, where edges represent the connections between two nodes.
The ability to understand the relationship between different, and dispersed, data points makes it possible to perform deeper analysis and deliver the results as information that can be easily understood and acted upon. If you think about healthcare and all the different applications used to collect data about a patient, you can quickly see how this approach to analytics has tremendous value. The image below, generated by TigerGraph for UnitedHealth Group, illustrates how information derived from graph analytics can be presented to a doctor as an interconnected timeline so everything can be seen at a glance to better serve their patients.

Knowledge graph analytics can also translate into significant savings in time and money. For example, UnitedHealth Group implemented TigerGraph in its contact centers and estimated it has saved $150 million a year by enabling its medical professionals to provide accurate and effective care path recommendations in real time.¹ TigerGraph has been one of the leading vendors in the graph analytics field, and Dell Technology customers have had great success when implementing it on Dell infrastructure. There are a few major features that makes TigerGraph a great partner:
To learn more about the ongoing collaboration of Dell Technologies with TigerGraph please view the TigerGraph partner brief, check out this paper developed by Information Week or visit our Analytics solutions website.
1 Source: TigerGraph, “UnitedHealth Group Improves Quality of Care While Controlling Costs with TigerGraph”, October 2020.